
Housing Affordability Part 1
/Which way for property prices this year? This is driven in part by housing affordability. But what do we mean by affordability and how do we best measure it? To my mind there are several ways of looking at housing affordability:
House prices versus average incomes
Proportion of household income needed to purchase an average property
Average weekly rent versus average incomes
Each of these methodologies tells a different story.
Prices v Incomes
The first method, while it does not take into account borrowing costs is useful in that it measures the relative difficulty of new home owners entering the market: the size of the deposit gap. This methodology suggests we have a big problem, particularly in Sydney where more than 8.5 x average annual gross income is needed to purchase the average property and Melbourne where the multiple is 6.8. With no first home buyers' grants or Stamp Duty relief available for most first home buyers this makes it exceedingly difficult for many to enter the market.
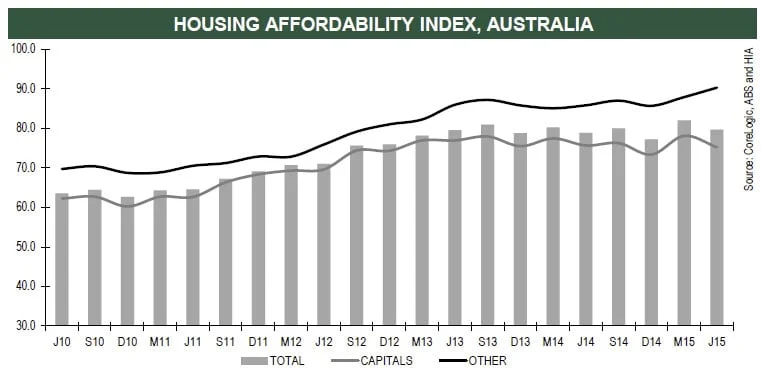
Capacity to Pay
The second method, adopted and published by the Housing Industry Association tells a different story; i.e. affordability has been steadily improving over the past 5 years. The main reason for this is the dramatic drop in housing interest rates over the same period. Real borrowing costs (i.e rates charged by lenders) have dropped by around 2.00% pa. Recently this has flattened or increased slightly as rises in housing prices and recent interest rate increases start to make an impact. This measure of affordability explains, at least in part, why purchasers could afford to push the real estate markets across Sydney and Melbourne to record levels over the past 2 years.
Rental Affordability
The third measure is similar to method 1 as it is independent of interest rates. However, rental markets are more strongly influenced by the relative supply and demand for particular types of rental accommodation, and also the capacity of tenants to pay. Recent house price market growth in Sydney has not even been nearly matched by growth in incomes leading to what some have described as an affordability crisis, and also to a decline in real rental returns for property investors. This area of the market is hugely important because more than 7 million Australians rent and almost half of these receive some form of government assistance just to be able pay their rent.
So Where Are We Heading?
Whatever the measure, the real situation is far more complex. Not everyone earns an average income or purchases the average house. Where these general measures are useful is when trying to forecast people's behaviour or in the design of public policy. So a dramatic fall in rental affordability leads to greater need for government assistance and causes people to search for different living arrangements: moving to lower cost dwellings, lower cost suburbs , back in the with the parents, or to find another way of sharing their tenancy costs.
And what does this mean for house prices? The HIA affordability index suggests that there is still room for price growth in those markets which have not moved yet; i.e anywhere but Sydney or Melbourne. Sydney and Melbourne have likely peaked for now but if you are a first home buyer you are going to need some significant help to bridge that yawning deposit gap.
Finally, expect continuing action on the part of our regulators and governments to rein in house prices and rents. Too many Australians, whether they are home buyers or tenants cannot afford to live near where they work, increasing the impact on the infrastructure within our cities. People are going to demand better, more affordable solutions than those which are available now.
Bruce Carr