
Property trends in Sydney’s lower north shore
As 2021 draws to a close, the property boom seems to have reached its peak. We have adjusted to the new normal and are heading into a post-pandemic phase.
Stock levels have increased across all capital cities, finally returning some power back to the buyers in the market. Concurrently, however, interest rates are predicted to increase – with some lenders already raising their fixed rates.
Despite the slowing growth, house and unit prices in Sydney’s lower north shore are still highly impacted by the pandemic boom. Other factors have come into play, such as the recent APRA reform, which has raised the interest rate used by lender to assess loan approvals. This reform aims to target Australia’s increasing housing debt and is set to impact investors more than upgraders or first home buyers.
It has always been important to consider current property trends when purchasing in any suburb. Key statistics such as capital growth and median value can help determine whether you are purchasing in the right area, to ensure you are making a smart purchase decision.
Sydney’s lower north shore suburbs, which enjoy proximity to the city without the hustle and bustle, are a popular area for young professionals and those looking to expand their family or upgrade.
We’ve compiled data from eight indicator suburbs across Sydney’s lower north shore LGAs such as Willoughby, Mosman, and North Sydney to summarise the key property trends in the market.
Overall trends in Sydney
Table 1 shows fourteen LGAs in order of their house price capital growth over the last three years. As you can see, the figures across board have drastically risen in the past year. In Sydney’s lower north shore, Mosman takes the lead, with Willoughby and North Sydney showing relatively modest growth.
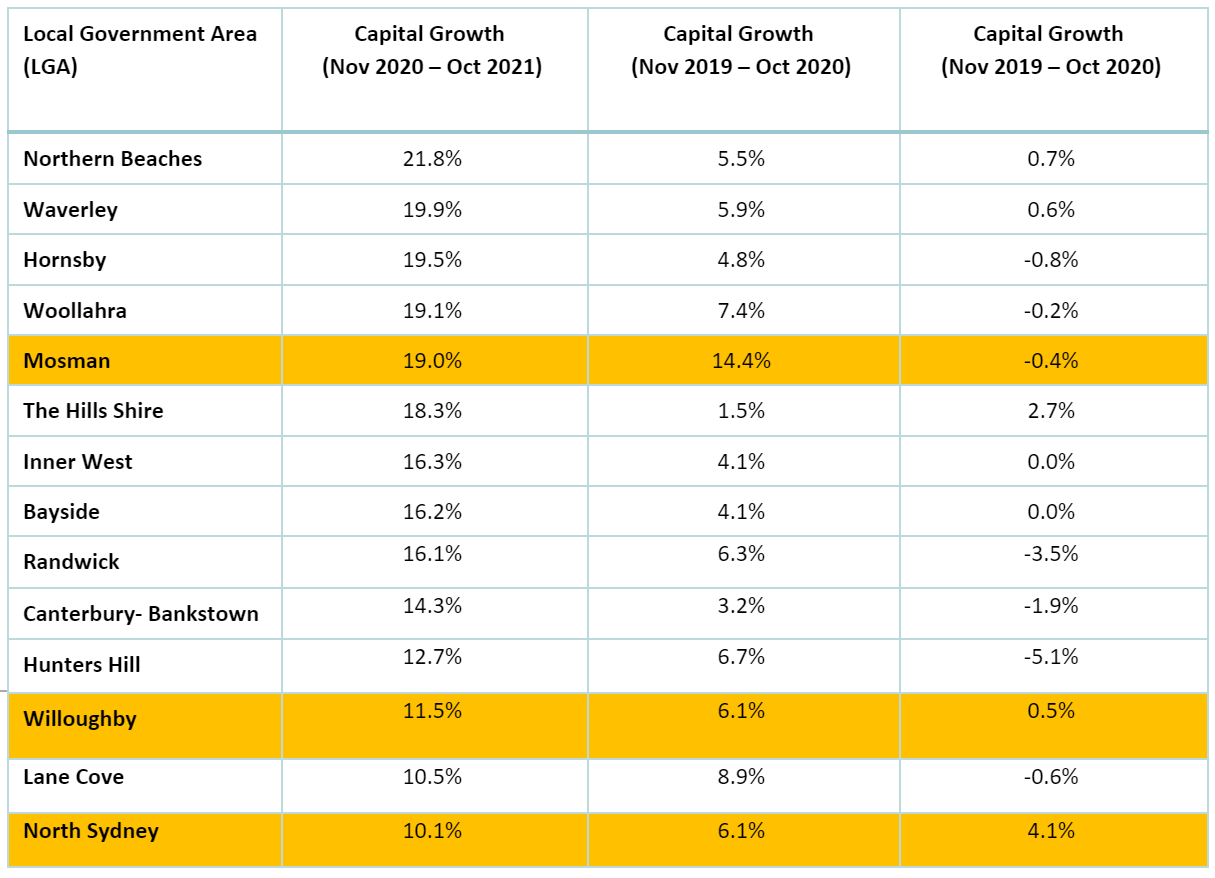
table 1: Key Sydney LGAs by capital growth (Source: CoreLogic Residex)
From the three key LGAs of Sydney’s lower north shore, we’ve summarised data across eight indicator suburbs. These are Artarmon, Cammeray, Chatswood, Mosman, Neutral Bay, St Leonards, Willoughby, and Wollstonecraft.
Sydney’s lower north shore trends – houses
Table 2 shows that Mosman leads the way with 19% capital growth on houses in the past year, showing its ongoing outstanding appeal. Low house sales (and consequently, data) have rendered St. Leonards an outlier for capital growth.
Demand for houses in Sydney’s lower north shore remains steady while there is a relatively low turnover as families typically buy to live long-term. Houses in this area boast spaciousness, land, and proximity to well-renowned schools – all factors that contribute to the value of living in this area.
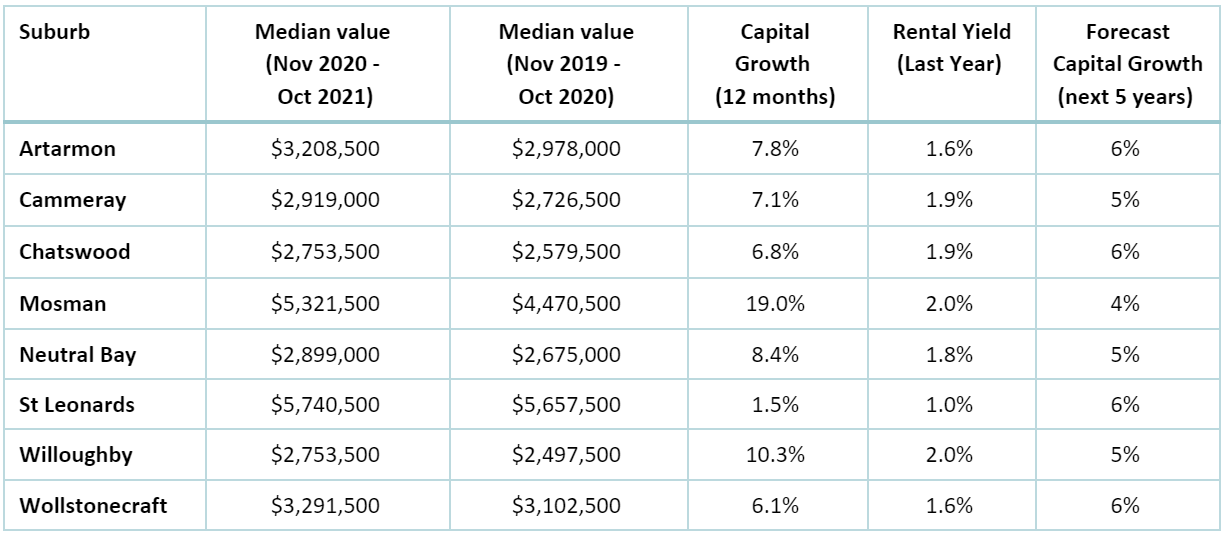
table 2: lower north shore HOUSING TRENDS (SOURCE: CORELOGIC RESIDEX)
Sydney’s lower north shore trends - units
In contrast to family-occupied houses, units in Sydney’s lower North Shore tend to house young professionals – often double income no kids households.
Across the board, prices have steadily increased, with only Willoughby remaining under the $1m threshold. The rental yield for units compared with houses is higher, and with the expected resumption of immigration, is expected to continue or increase.
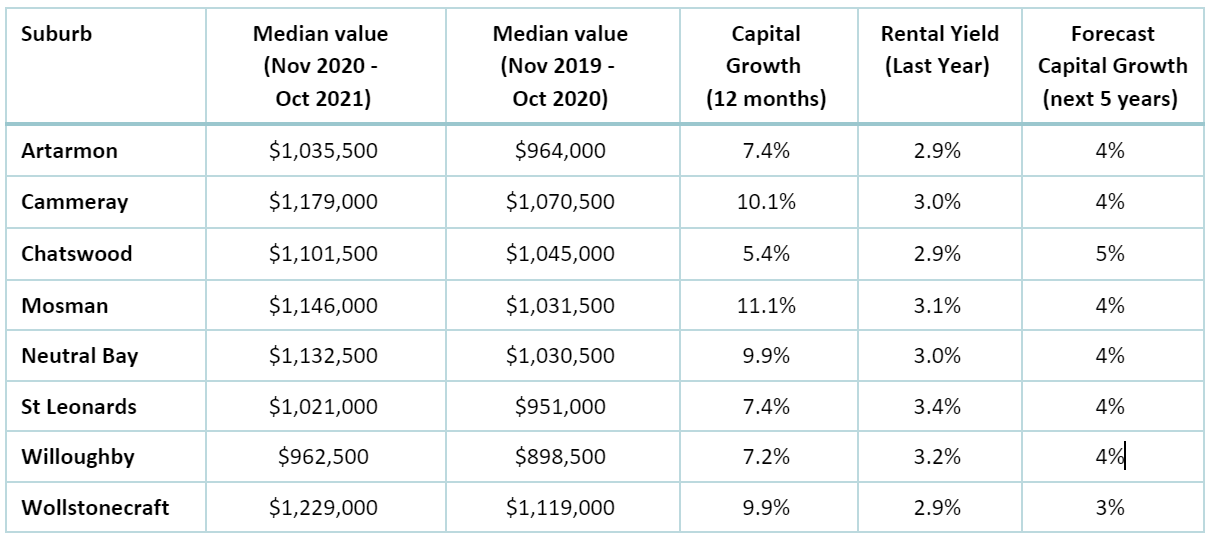
TABLE 3: lower north shore UNIT TRENDS (SOURCE: CORELOGIC RESIDEX)
Tips for home buyers
Prospective home buyers should keep informed on the housing market to ensure they make the right choice. Here are some tips to consider when purchasing your next property:
Watch the market – Post the pandemic boom, the housing market is turning quickly – growth in prices is set to slow, while interest rates are set to increase.
Be prepared to be flexible – If the market price for your desired area is beyond your budget, consider looking for properties with long-term value in lower cost areas.
Think long-term – Ensure that the property you buy fits into your long-term vision or this will result in high transaction and time costs in the future.
These tips will help you through your next property purchase, whether you’re buying in Sydney’s lower North Shore or another area.
References
Residex Marketfacts, 2021. Local Government Area Statistics Report: Suburban Sydney. CoreLogic.
Residex Marketfacts, 2021. Suburb Statistics Report: Mosman, Cammeray, Neutral Bay, St Leonards, Wollstonecraft, Chatswood, Artarmon, and Willoughby. CoreLogic.
Social sharing
Disclaimer: This article is intended to provide general news and information only. While every care has been taken to ensure the accuracy of the information it contains, neither Loanscape nor its employees can be held liable for any inaccuracies, errors or omission. All information is current as at publication release and the publisher takes no responsibility for any factors that may change thereafter. Readers are advised to contact their financial adviser, broker or accountant before making any investment decisions and should not rely on this article as a substitute for professional advice.


Loanscape has today released its Borrowing Capacity Index for Q4/2024. It confirms the forecast trend that borrowing capacities of Australian individuals and families are recovering from their low levels which coincided with the last of the recent increases to borrowing rates initiated by the Reserve Bank of Australia.