

KISS
Republished from Matusik Missive
This week I want to cover the Australian economy. Well, my take on things economic. And in particular I want to put a final nail in the ‘wage growth is coming’ palaver.
I will try to Keep It Simple Stupid, not for you so much dear reader, but for my dull intelligence.
Eight charts and one table this post – I have been on a roll in recent weeks – and they do take a fair bit of time and effort to put together, as yes, the Missives are my main promotional tool, but donations are very welcome. My bank account says thanks!
So, enough self-promotion, let’s start with chart 1.
Chart 1 shows that Australia’s population growth has slowed down since the start of the COVID restrictions, and by my estimates there will be 750,000 less people living in Australia by the middle of this year, than might otherwise have been the case if the federal government didn’t lock out overseas migrants.

Chart 2 updates previous commentary, showing that despite the government largess over the past two years, COVID has driven a half billion dollar hole in the Australian economy.
My third chart shows that – despite last month’s ‘apparently’ strong job growth result – the size of Australia’s labour force still remains smaller over the past two years, again when compared to its potential size, based on the pre-COVID trend.
I say ‘apparently’ because from my perspective the ABS employment data and the current 4.2% unemployment figure is fake.
As I have written several times before, Roy Morgan Research do a much better job measuring unemployment across Australia, and they suggest that Australia’s rate of unemployment is rising and is currently 8.5%.
Did you know that the current ABS data counts as employed 131,000 people working zero hours for economic reasons and a further 222,000 people doing the same ‘zero hours work’ due to illness, injury or sick leave? There are obviously always people in the second category, but in recent years that number has been elevated.
Making the appropriate adjustments sees the ABS jobless rate lift from 4.2% to something like 5.5% to 6%.
Chart 3, below, is based on ABS data and it shows that at the start of the pandemic the size of the Australia’s employed workforce shrunk by 896,000 people and today (based on a somewhat fantasised 4.2% employment rate) the size of Australia’s employed workforce is just 83,500 short of the pre-COVID trend.
Using Roy Morgan’s survey results, saw the March 2020 employed diminish by 1.1 million workers and today the size of the Australian employed workforce is still 239,500 workers short of where it could have been if COVID hadn’t happened.

Regardless of sample source, one of the big reasons for the fall in both the unemployment and underemployment rate has been because of people giving up looking for work.
Whilst some of the workforce may have retired and others whose children went to daycare or school stopped working in order to attend domestic duties and home school, many in the labour force, I believe, just gave up.
Some may question this statement, but on my side of the argument, the current labour force participation rate is 66%, which is higher than in March 2020 when pandemic commenced in earnest on our shores.
Furthermore, Australia’s employment to population ratio has also risen over the last twelve months to be the highest on record.
And on the flip side did you know that since late 2019, the number of ‘main’ jobs rose by just 1.4% whilst the number of ‘secondary’ jobs increased by over 10%. So, more people are working a second or even third job to make ends meet.
Chart 4 clearly illustrates that domestic wages are not putting pressure on inflation.
Prices are not rising because workers are demanding higher pay, but mostly because of supply-side issues and demand driven aspects like the overheated housing market.
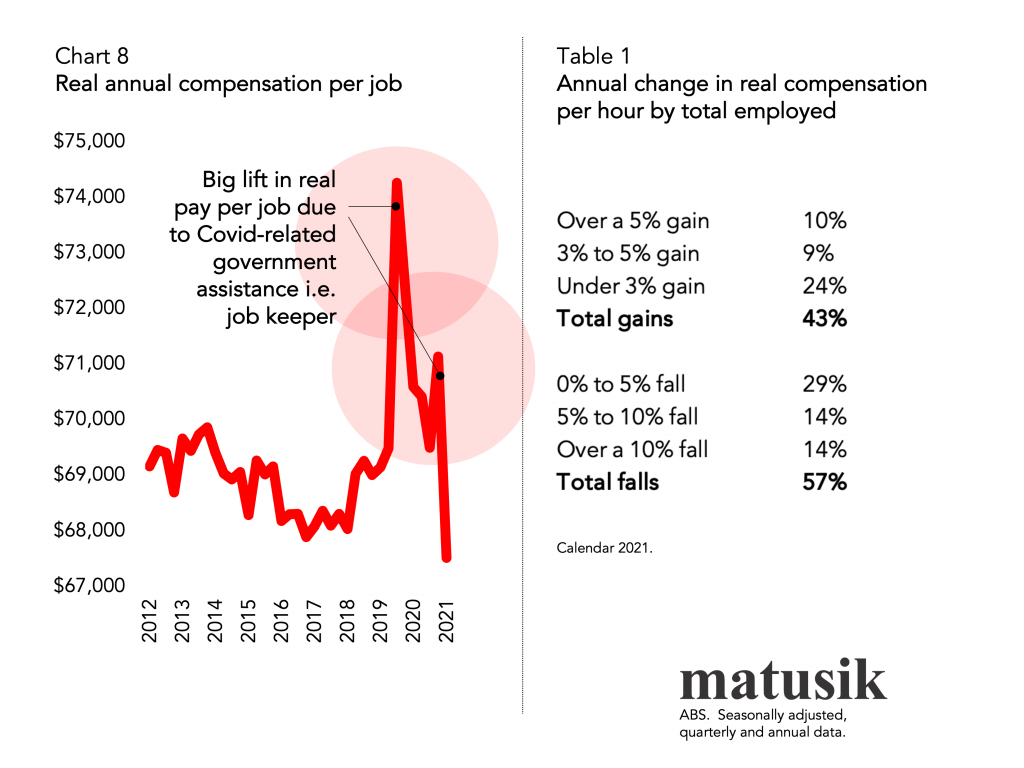
Chart 8, later in the post, shows how real incomes rose due to government largesse during the pandemic. This led to a lift in domestic demand whilst COVID-related restrictions constrained supply.
Additionally, chart 5, highlights that the link between unemployment and wage growth remains much reduced. I do think that this relationship will condense further.

Chart 5 also suggests that the predictions of wage growth rising above 3% per annum in coming years is somewhat fanciful, regardless of what unemployment does.
And we now have a very likely return of high net overseas migration which will add more bums of seats and further dilute generic wage growth as labour supply increases and recent immigrants accept lower renumeration.
But for mine the bigger problem is that many workers are not getting rewarded for their efforts.
Whilst government spending boosted our economy during the pandemic, the private sector hasn’t really yet picked up the slack. And business really cannot blame labour costs.
Chart 6 shows that over the last three months of 2021, real labour costs fell and are now 4% below what they were prior to the pandemic.

And in the last December quarter just 46% of GDP went to the compensation of employees – 1.5% lower than two years earlier – and lower than in any time in Australia’s economic recorded history.
Adding further salt into the wound, is rising inflation, which as chart 7 shows, is causing real wages for both the private and public sectors to actually fall.
Real compensation per job is now less than it was ten years ago (see chart 8) and during 2021 57% of Australia’s workforce saw their wages (again in real terms) actually fall. One in seven workers (14%) have seen their real take home pay fall by over 10% over the last twelve months. See table 1.
Furthermore, as a result of rising inflation, interest rates are likely to rise, adding even more pain to most working Australian households.
And of course, there is the impact of the recent floods and the tragic unfolding overseas events to content with too.
In conclusion my economic KISS hypothesis suggests two things:
Firstly, there is nothing to suggest that most Australian workers are about to receive some mystic windfall wage gains.
My thesis, if anything at all, intimates that the past decade of stagnant real wages is set to continue – it might even get worse – unless a prospective government seeks to do something meaningful about it.
Pigs might fly!
And secondly, as a result, the housing market is about to slowdown, and I believe, at best, enter a prolonged period of little price growth and limited sales activity.

Matusik Missive by independent property analyst, Michael Matusik. Every week Michael shares his thoughts on the Australian housing market.
Visit www.matusik.com.au to find out more.
Social sharing
Disclaimer: This article is intended to provide general news and information only. While every care has been taken to ensure the accuracy of the information it contains, neither Loanscape nor its employees can be held liable for any inaccuracies, errors or omission. All information is current as at publication release and the publisher takes no responsibility for any factors that may change thereafter. Readers are advised to contact their financial adviser, broker or accountant before making any investment decisions and should not rely on this article as a substitute for professional advice.


Loanscape has today released its Borrowing Capacity Index for Q4/2024. It confirms the forecast trend that borrowing capacities of Australian individuals and families are recovering from their low levels which coincided with the last of the recent increases to borrowing rates initiated by the Reserve Bank of Australia.